
Page 47 - GUIDELINES FOR FOOD SYSTEM PROFILE DEVELOPMENT at sub-national levels in Vietnam
P. 47
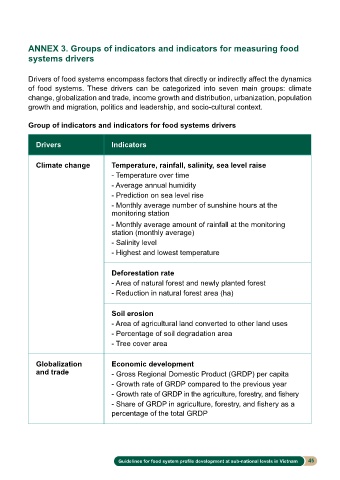
ANNEX 3. Groups of indicators and indicators for measuring food
          systems drivers


          Drivers of food systems encompass factors that directly or indirectly affect the dynamics
          of  food systems. These drivers can be categorized into seven main groups: climate
          change, globalization and trade, income growth and distribution, urbanization, population
          growth and migration, politics and leadership, and socio-cultural context.

          Group of indicators and indicators for food systems drivers


            Drivers                Indicators


            Climate change         Temperature, rainfall, salinity, sea level raise
                                   - Temperature over time
                                   - Average annual humidity
                                   - Prediction on sea level rise
                                   - Monthly average number of sunshine hours at the
                                   monitoring station
                                   - Monthly average amount of rainfall at the monitoring
                                   station (monthly average)
                                   - Salinity level
                                   - Highest and lowest temperature


                                   Deforestation rate
                                   - Area of natural forest and newly planted forest
                                   - Reduction in natural forest area (ha)


                                   Soil erosion
                                   - Area of agricultural land converted to other land uses
                                   - Percentage of soil degradation area
                                   - Tree cover area

            Globalization          Economic development
            and trade              - Gross Regional Domestic Product (GRDP) per capita
                                   - Growth rate of GRDP compared to the previous year
                                   - Growth rate of GRDP in the agriculture, forestry, and fishery
                                   - Share of GRDP in agriculture, forestry, and fishery as a
                                   percentage of the total GRDP


                                     Guidelines for food system profile development at sub-national levels in Vietnam  45